The Permafrost Thaw Action Group originated during T-MOSAiC (Terrestrial Multidisciplinary distributed Observatories for the Study of Arctic Connections).
The first data were collected in 2021 and we hope for more data contributions in the future!
T-MOSAiC is an IASC pan-Artic, land-based program that extends the activities of the IASC flagship program MOSAiC. The MOSAiC expedition was a multinational year-round study (2019-2020) of the central Arctic Ocean, based on one of the largest polar expeditions in history.
The Permafrost Thaw Action Group will guide community-driven data acquisition and synthesis efforts across circum-Arctic gradients in permafrost and climate conditions. To better understand why multi-parameter observations of permafrost thaw are necessary, let´s have a closer look at what permafrost is and how it affects climate change.
What is permafrost and what is it made of?
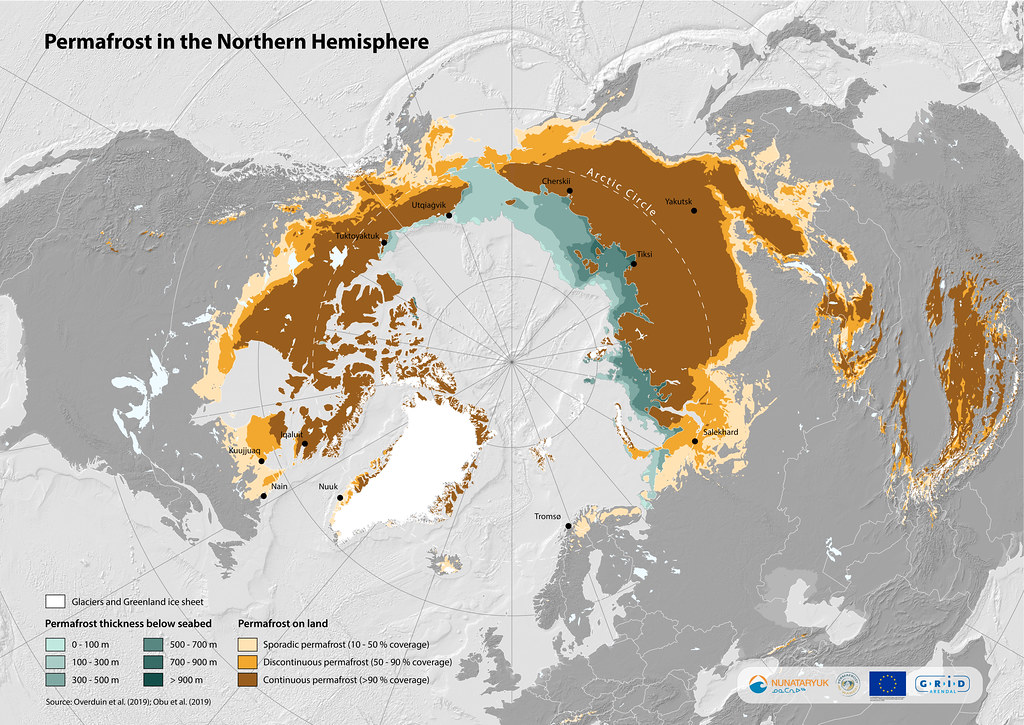
Researchers use the term permafrost or permanently frozen ground when the temperature of the ground remains under zero degrees Celsius for at least two consecutive years. Permafrost is much more common than generally assumed – and underlies roughly a quarter of the land area in the Northern Hemisphere. The majority of permafrost is found in the Polar Regions but permafrost also exists in high mountain ranges. Permafrost can be found on land (terrestrial permafrost) and below the seabed (submarine permafrost).
The material of permafrost can consist of rock, sediment or soil. It can contain varying quantities of ice. Based on its continuity, permafrost can be separated into continuous (>90 % coverage), discontinuous (50 – 90 % coverage) and sporadic (10 – 50 % coverage). Typically, permafrost is overlain by an active layer which thaws every summer. The thickness of the active layer greatly varies and can even be up to 1.5 m (e.g. on Svalbard). In the active layer, the majority of biological and biochemical activity in Arctic soils happens.

Effects of climate change on permafrost
Climate change is destabilizing permafrost landscapes, affecting infrastructure, ecosystems and human livelihoods. The impacts of permafrost thaw on ecosystems are expected to increase with climate warming, changes in precipitation, and increasing surface disturbance. Especially in regions of ice-rich permafrost, thawing can lead to surface subsidence and slope instability.

The inter-annual variations of the active layer thickness offer insights into short-term climate fluctuations. Temperature measurements in boreholes reaching the lower layers of the permafrost provide information about long-term climate changes and make it possible to gauge the effects of global warming on the polar and mountainous regions.
The temperatures of permafrost and active layer thickness are increasing, but there is considerable spatial variability in the magnitude of the change, as they are linked to local variations in snow, vegetation, and soil characteristics. These local variabilities are critical for the evaluation of permafrost thaw. Not only do the rate and nature of permafrost thaw depend on factors such as snow depth, the thickness of the organic layer, and vegetation height, but permafrost thaw will in turn influence these variables.
Scope of the project

Northern landscapes and infrastructure are threatened by degrading permafrost. Areas underlain by ice-rich ground are particularly prone to terrain instability in the form of collapse and slumping. Current Earth System Model projections, however, do not account for thaw-induced terrain changes and associated subgrid processes. They thus cannot represent the impacts on and feedbacks with ecosystem functioning, hydrology, and carbon turnover.
The Permafrost Thaw action group will guide community-driven data acquisition and synthesis efforts across circum-Arctic gradients in permafrost and climate conditions. The development and sharing of field and data protocols are central to our strategy.
The protocol for data collection
The Permafrost Thaw AG developed a multi-parameter, user-friendly protocol for standardized monitoring of the permafrost thaw. You can assess our paper here.
Multi-parameter observations are necessary to understand and predict permafrost thaw and our protocol provides a guideline for standardized collection of field data for quantifying permafrost thaw. It addresses the need for integrated observations of multiple connected components of permafrost landscapes, including soils, snow, and vegetation.
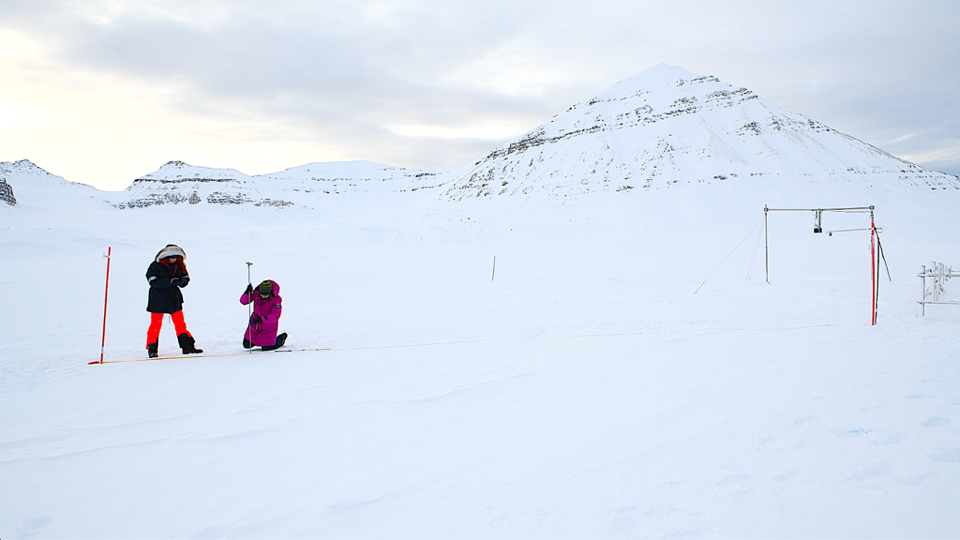
The protocol is structured according to spheres and parameters: snow (snow depth), permafrost (thaw depth), vegetation (vegetation height), water (water level) and soil (texture and structure).

The protocol requests basic information about the site location, including latitude, longitude, elevation, and the location of the nearest weather station. This information is crucial for both mapping and modelling, and therefore adds greatly to the usability of the data collected.
We then request an overview of the site characteristics as seen by the eye, including whether the site is rocky, what type of soils are there, and how wet it is. For example, it may be a very wet or dry site, or it may be mixed, and these overview assessments, while providing similar information to the spheres themselves, will give an overview of the site as a whole.
This also provides further information regarding how representative the transect measurements are. While vegetation height is covered in its own sphere, the dominant type of vegetation merits inclusion as metadata because it is a key indicator of the type of site. Basic information about any water features, such as ponds and rivers, as well as natural and anthropogenic disturbances are recorded because these will also affect the site, impacting the hydrology and permafrost thaw.
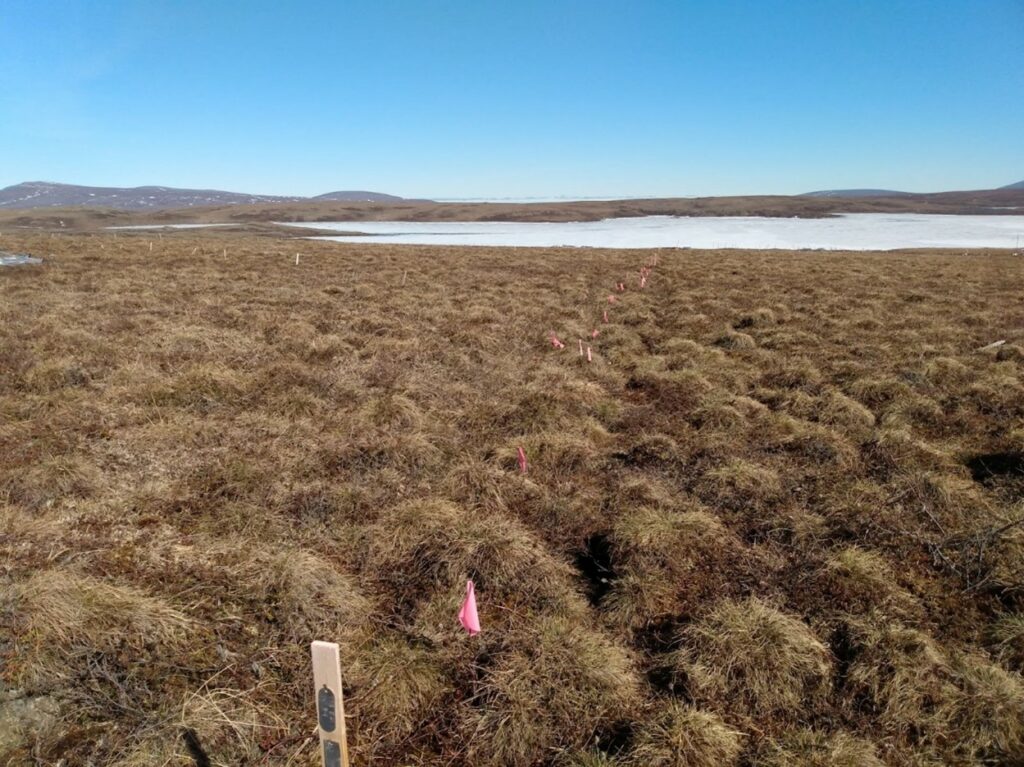
Photos are required in the four cardinal directions in a standardized manner that provides a sense of scale, to give an overview of the site and clarify descriptions. An additional photo shows the placement of the transect.
Based on the protocol we developed the mobile app myThaw, which is freely available and easy to use – no knowledge or sophisticated equipment is needed to join us in collecting data on the permafrost thaw.
The app allows the collected data to be exported to a central data storage for data analysis and reporting. The app is designed for use in cold climates. You can access data, collected through myThaw app, here.
Please join our data collection campaign if you live in or visit any permafrost region. The measurements are simple to take and upload (more information can be found under myThaw app).
